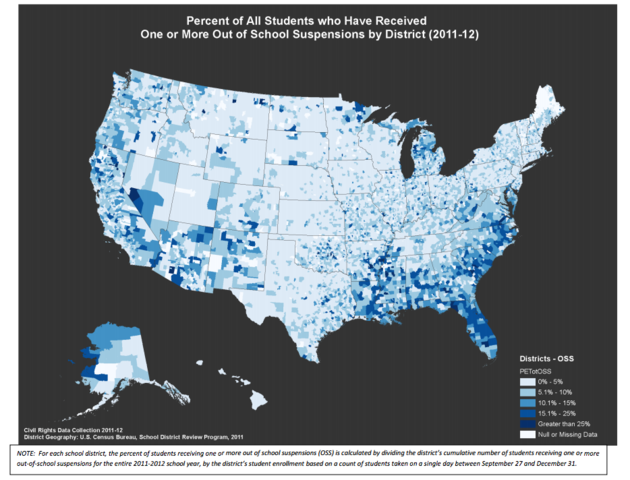
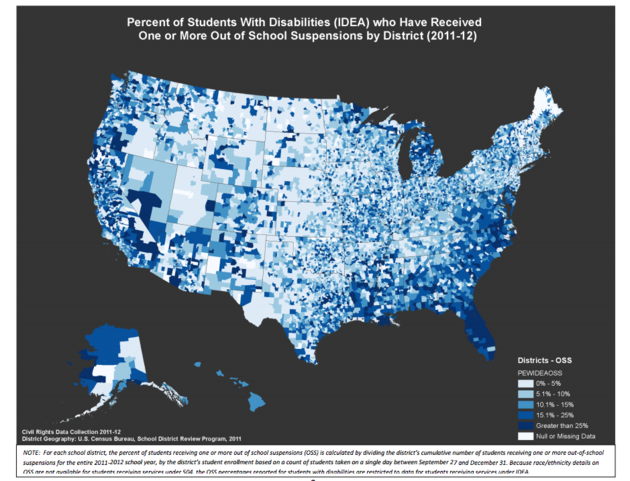
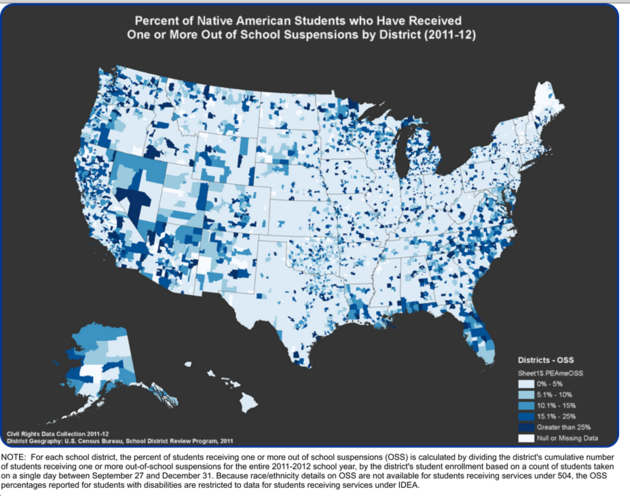
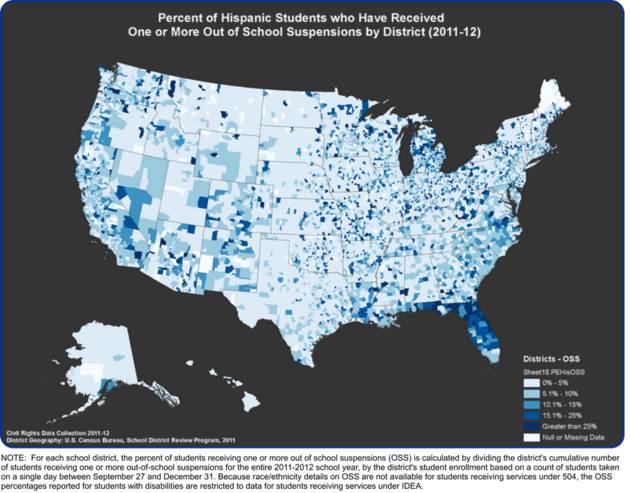
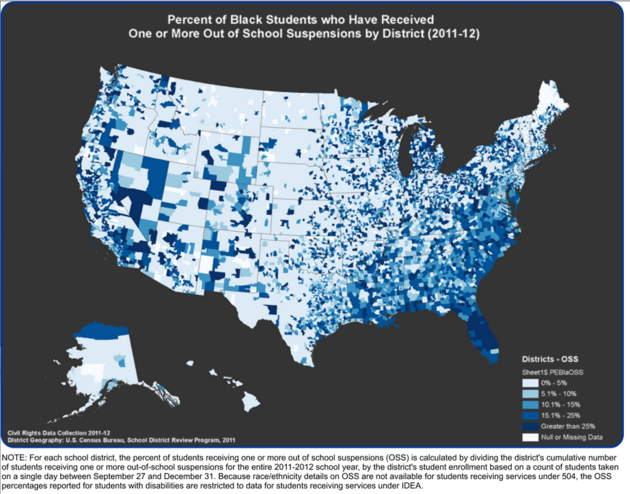
As a follow up to last week's post on ending the school to prison pipeline, check out these graphs that show suspensions across the US, broken up into students with disabilities, Native American students, Hispanic Students, and Black Students, in 2011-2012.


 RSS Feed
